Exploratory Data Analysis on Bitcoin Price with Python

Link to the dataset: Here
Link to my code: Here
Data Description
Bitcoin is a decentralized digital currency that has gained popularity in recent years as an alternative to traditional currencies. One of the key features of Bitcoin is its volatile price, which can fluctuate rapidly in response to various factors such as news events, regulatory changes, and market sentiment. In this report, we will explore the historical price data of Bitcoin and try to uncover some insights and trends.
The Bitcoin price data used in this analysis was obtained from Kaggle community and covers the period from September 2014 to April 2023. This data was published by ALEXANDER KAPTUROV.
The data includes:
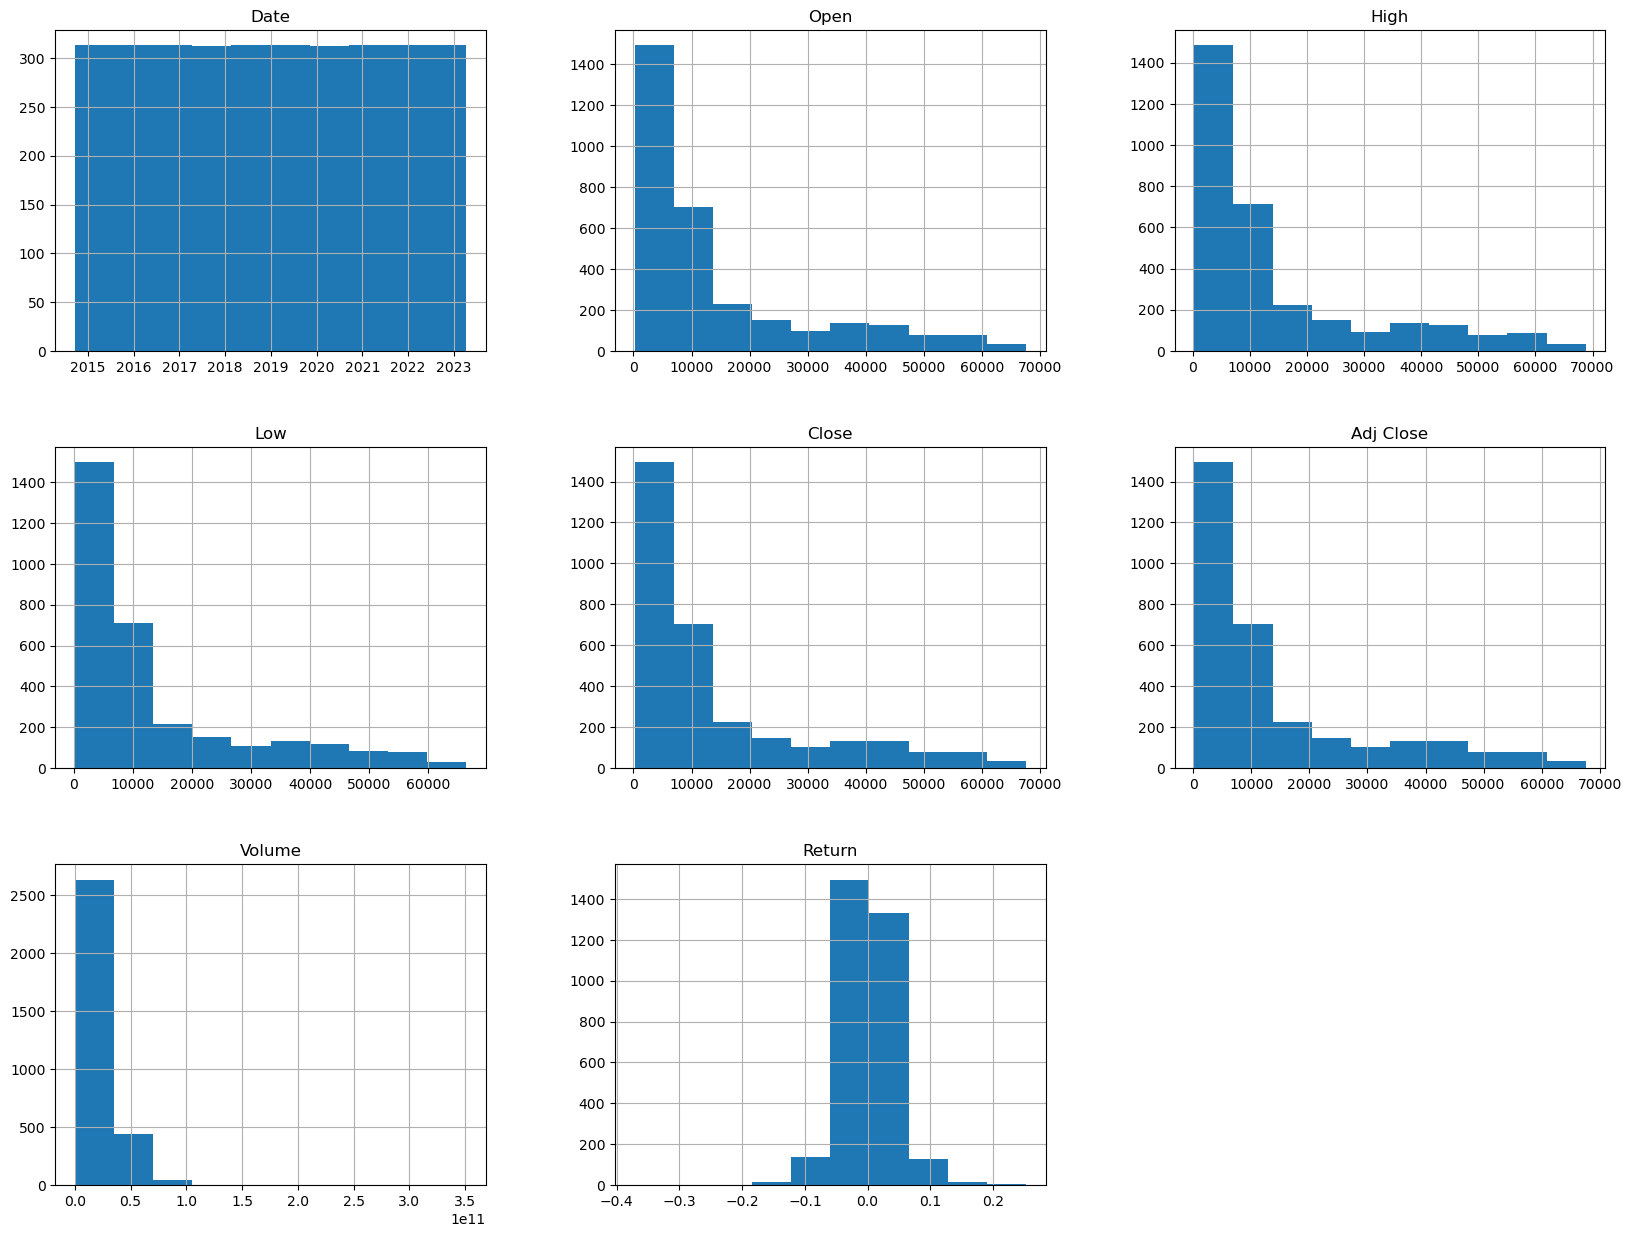
- Date: The date on which the cryptocurrency prices were recorded. This column is usually in the YYYY-MM-DD format.
- Open: The opening price of the cryptocurrency on that date.
- High: The highest price of the cryptocurrency on that date.
- Low: The lowest price of the cryptocurrency on that date.
- Close: The closing price of the cryptocurrency on that date.
- Adj Close: The adjusted closing price of the cryptocurrency on that date. This is the closing price adjusted for any corporate actions such as stock splits or dividends.
- Volume: The total trading volume of the cryptocurrency on that date. This represents the total number of coins that were traded on that day.
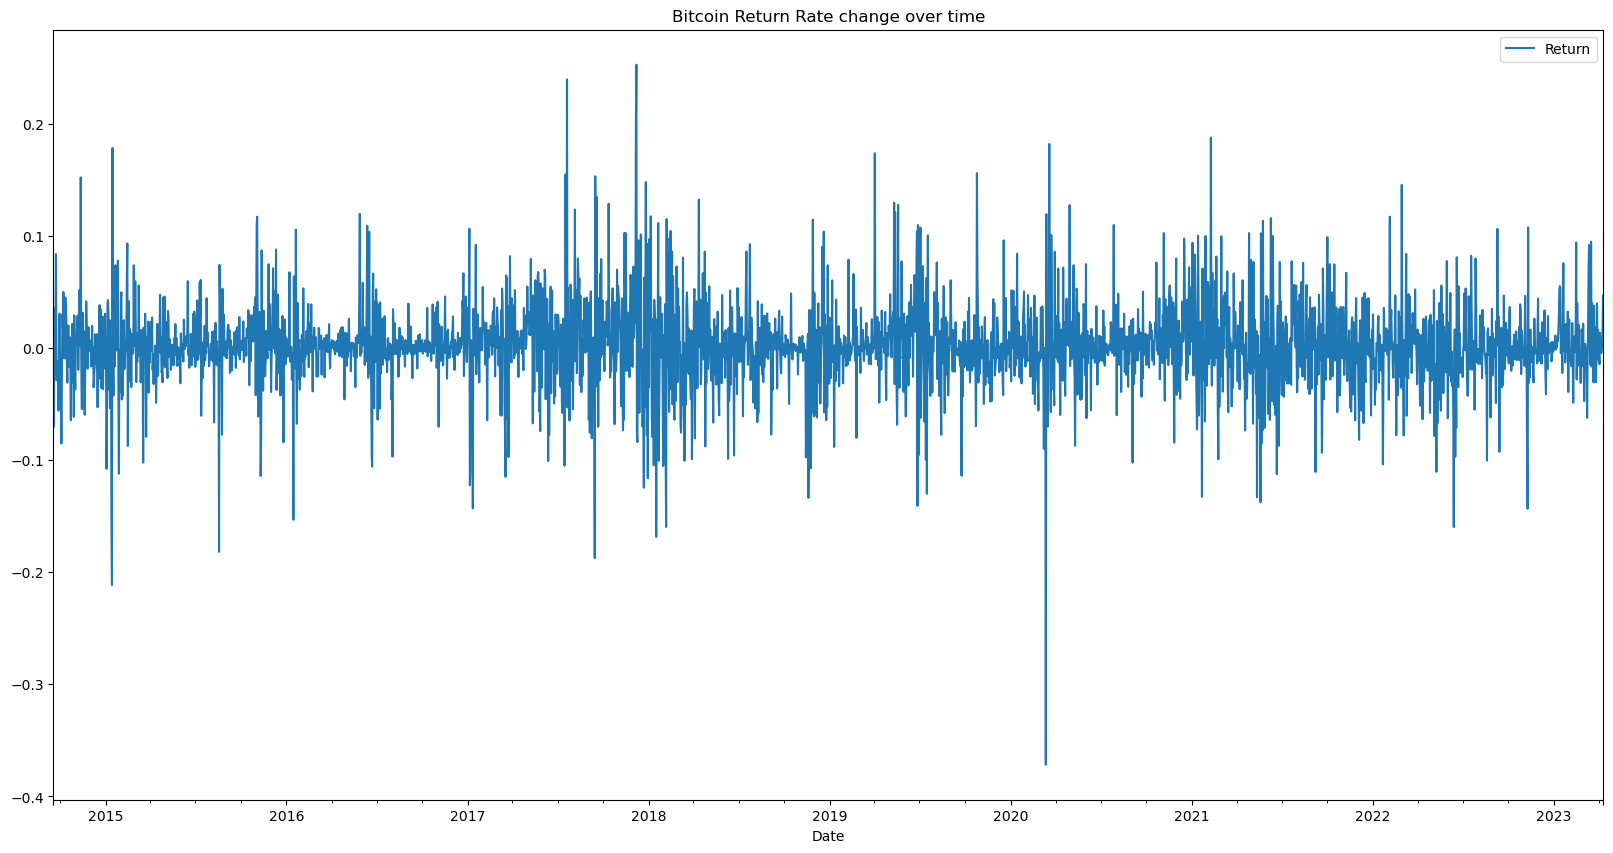
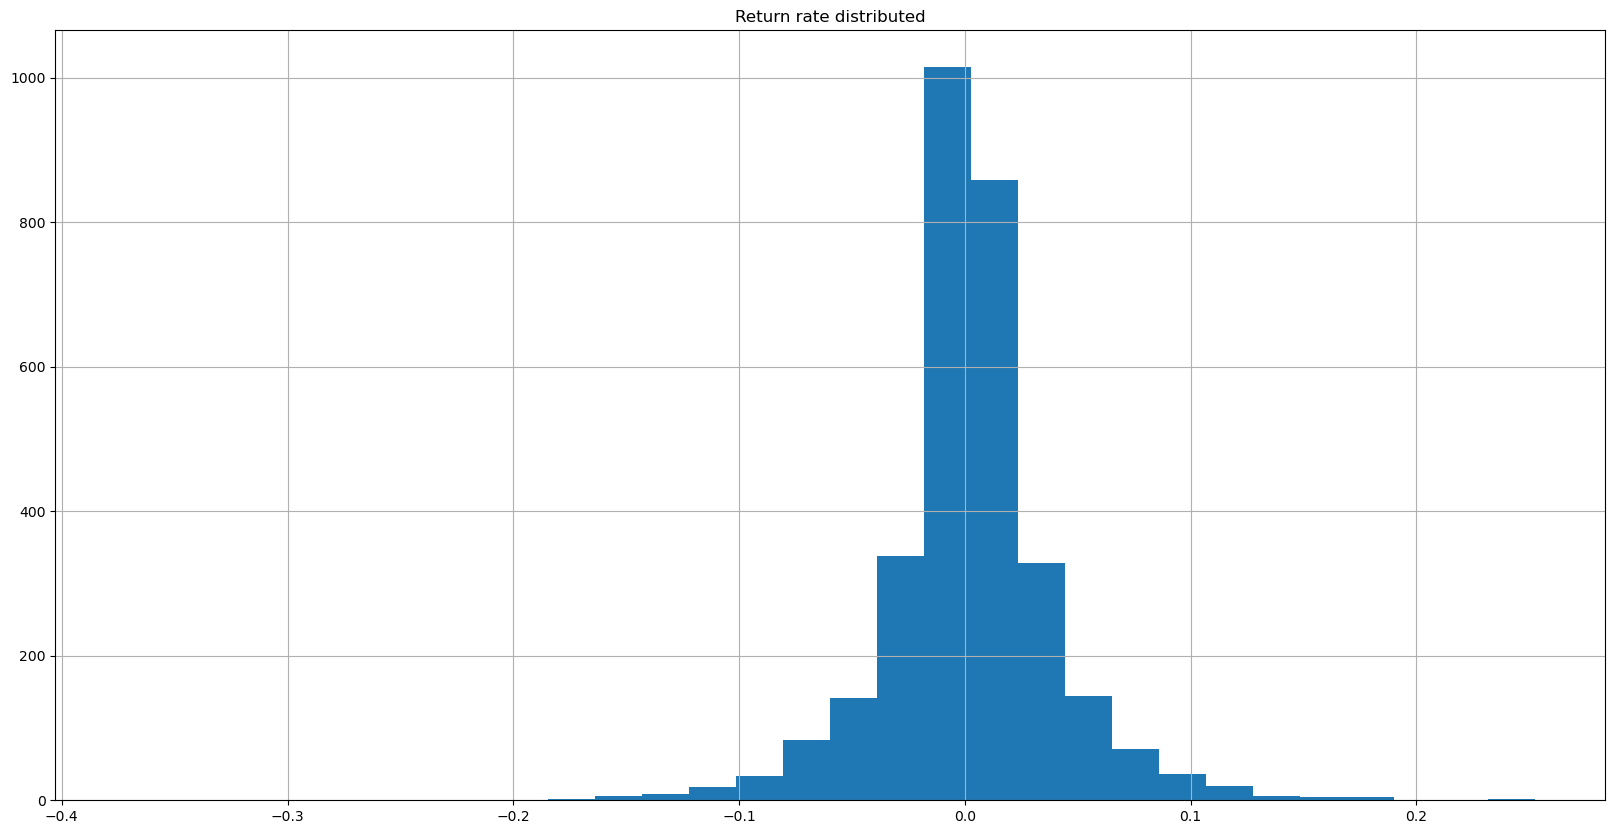
- Return: The changing price in percented
Exploratory Data Analysis
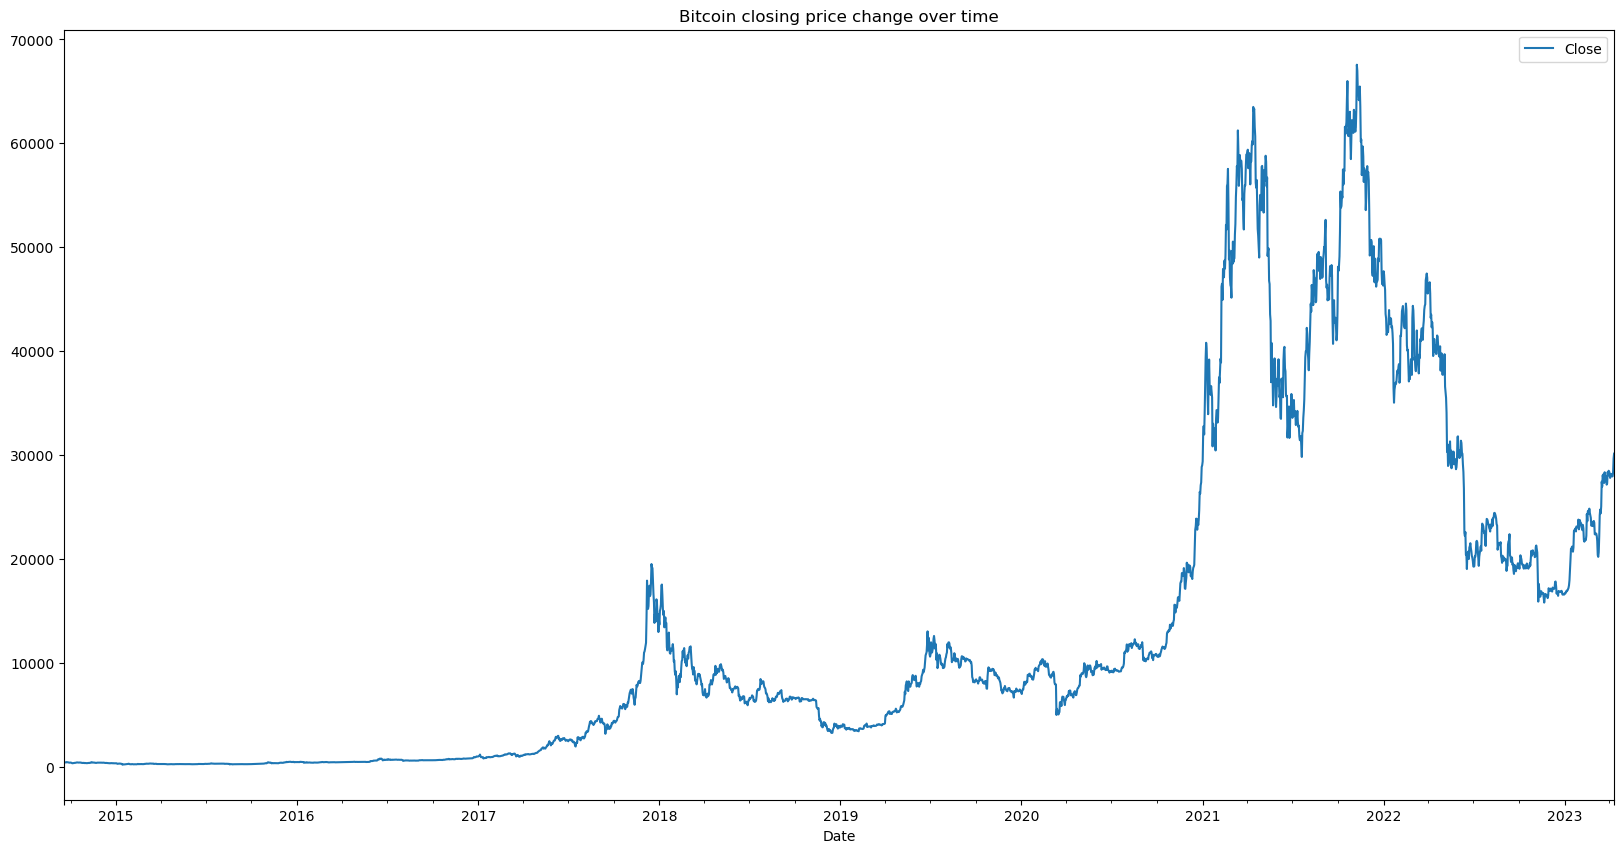
Now first take a look on how Bitcoin price changing over time.
Conclusion
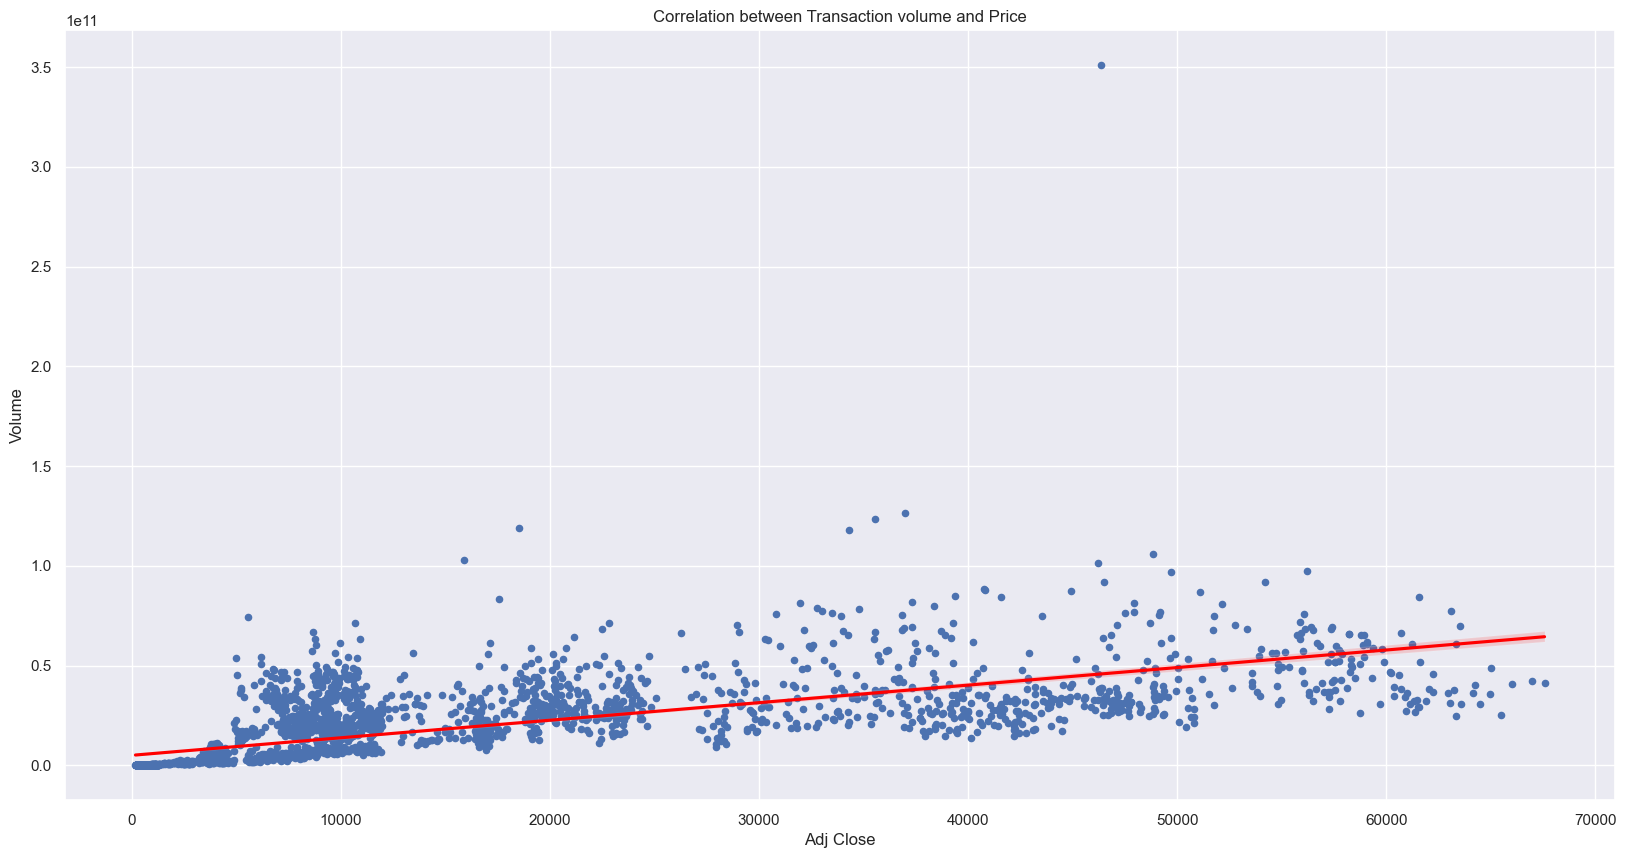
In this report, we analyzed historical data on bitcoin prices using EDA. We found that bitcoin prices have been highly volatile over the past decade, with several sharp increases and decreases in price. The daily returns of bitcoin have been largely symmetrical over the entire period. We also found that the prices of bitcoin and other cryptocurrencies are highly positively correlated.
These insights can be useful for investors who are interested in investing in cryptocurrencies like bitcoin. However, it is important to note that cryptocurrencies are highly speculative and volatile, and investors should carefully consider the risks before investing. Overall, EDA provides useful insights into the historical trends and patterns of bitcoin prices, which can aid in making informed investment decisions.